How to make your software transition successful
Discover what is at the heart of a good software transition plan and what the transition journey consists of.

Modern resource management, HR and recruitment offices have to process remarkably large volumes of data: portfolio research, social media screening, skillset identification, references, and most importantly, resumes and CVs. Luckily or unfortunately, every professional segment, in global terms, has developed its own particular set of requirements that are necessary for actionable insights on every particular candidate’s qualifications. There is no unified standard for a Curriculum Vitae. Consequently, some candidates consider sharing just basic relevant info, others seek to present themselves as multi-talented individuals, and some believe that the personal interview is crucial, leaving the resume out as a minor item. So, digging relevant insights from CVs is frequently a time- and effort -consuming process for resource management and recruitment specialists.
This is exactly an area where technology, and namely data science, can become a viable instrument in optimizing quality and speed in the recruitment process and, more importantly, provide fact-based analytics of the data and insights to be driven from it.
Today, I am going to show how we used natural language processing to understand the resume and then parse the information from it. The approach we applied to extracting relevant entities made it possible to group the real-life resumes and find similarities according to the required set of features.
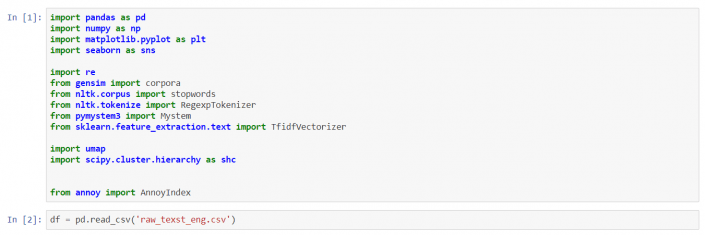
To start at the beginning, every candidate compiles their resume the way they consider the best, also opting for the most suitable formats. Our real-life database contains pdf, doc, docx, img, rtf, etc. formats. That’s where a good checked Textract package, by Python, comes in real handy. It’s comfortable and great for understanding, though there might be some issues with its installation because of the combination of different solutions for various formats under the hood. When skillfully applied, we can come up with a variety of texts for the resumes. At the research stage we save all these into the file.
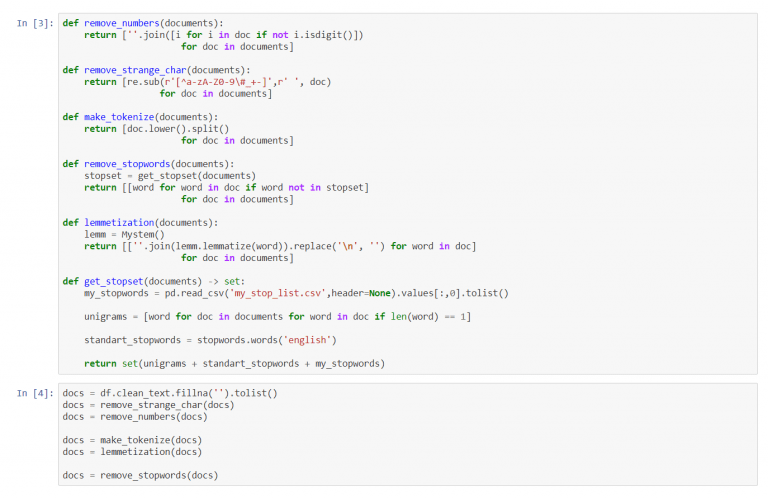
Mainly, all the work with the text starts with it being split into tokens. Here we considered a word as a token. For our analysis we needed to have the most informative words.
So first, we clean out all the unnecessary things: symbols, punctuation marks, numeric digits, etc.
Then, we applied lemmatization. The goal of lemmatization is to reduce inflectional forms and sometimes derivationally related forms of a word to a common base form. Words that are derived from one another were mapped to a central word or symbol, especially if they had the same core meaning.
At the next stage, we got rid of the non informative words like pronouns, adverbs, prepositions, etc. (e.g. the, is, off, than), as well as those that were off-topic (football, inspiration, present, ability, etc.). A set of those words was formed and added in during the course of the research.
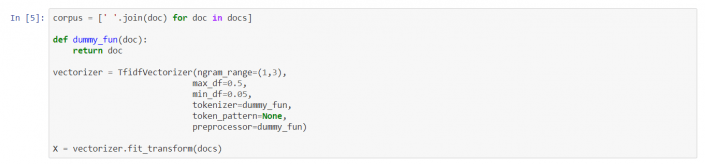
Now, with the composition of the obtained tokens, we built a vector space where each resume was presented as a point. There are several approaches to vectorization. We applied TF-iDF (term frequency–inverse document frequency) as this allows for wider possibilities in further interpretation of the results, which is used later in the process. It transforms each unique word to a value, which can be interpreted as a value of “importance” for the word in a particular text.
There is a considerable drawback in the word tokenization approach, as the words’ sequence in the sentence is not taken into account. It can partly be solved with the application of n-grams. N-gram is a sequence of ‘n’ items from a given sample of a text. It allows one to take into account collocations.
We can allocate n-grams, which are the most frequently come across words in the text, and add them to the general feature list. The success of text analysis hugely depends on the purity of features. The key point of this research is the selection of max_df and min_df. The tuning of the parameters can obtain really important n-grams.
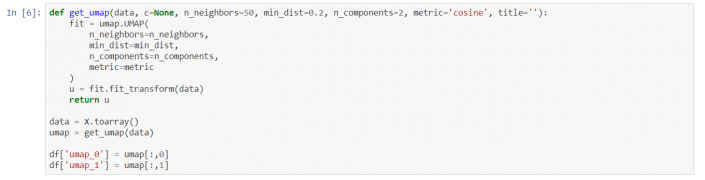
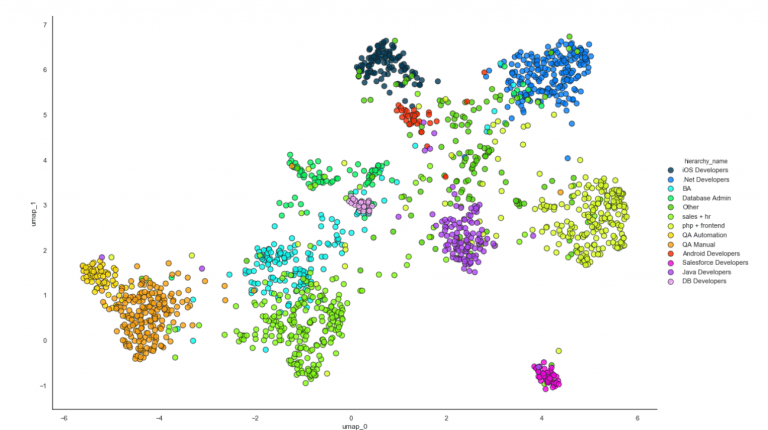
In order to receive a more complete picture of how our resumes are located in the multidimensional space, we opted for the building of a 2D projection of the data. Now we can observe a certain structure of the main space.
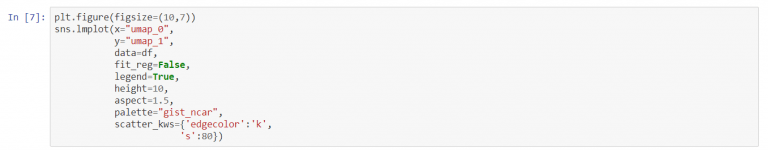
In order to visualize the texts, we used a powerful and fast UMAP. It allowed us to get projections in 2D and 3D. We used the first one. Using UMAP projections we tuned the vectorizer parameters based on the iterative method.
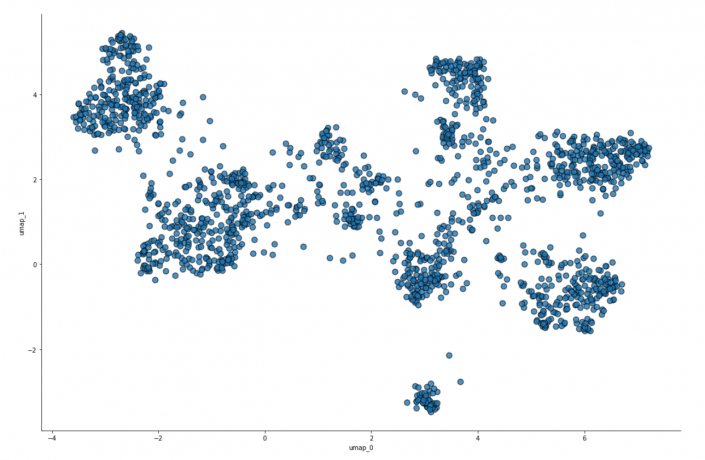
The resulting picture looks quite fascinating. There are a few clusters which are supposed to conform to the candidates’ from the same field. You also might notice that there are certain candidates that do not belong to any clusters, which means that either our corpus failed to be perfect or that those particular candidates switched to different technologies.
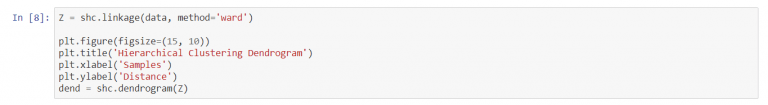
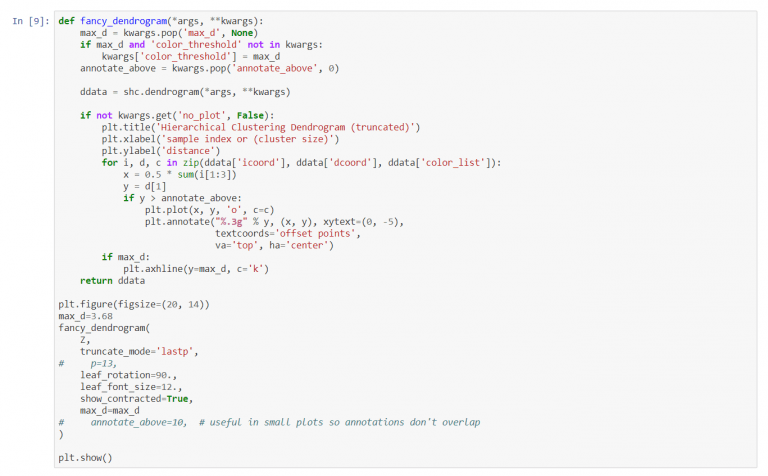
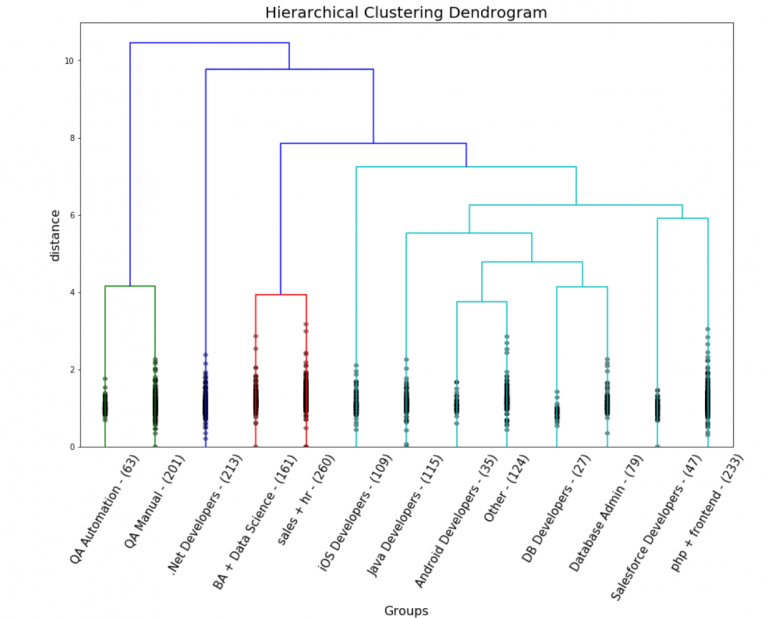
We will identify those patterns by applying machine learning methods. That’s where we need to apply an unsupervised approach. But which algorithm suits our purpose the best? There is an assumption that all technologies are connected and these relations can be represented as a tree-like structure, as most IT tech originated programming. In the course of time, the programming split into groups, than those broke down into further groups, etc. This issue can be addressed by means of a hierarchical clustering analysis.
We’ll have to keep this in mind: that this is a hard type of clustering, so an individual is assumed to belong to just one technology. Since we are dealing with text, we should use the cosine metric, and now we can visualize the tree. As we can see, our data can be split into 4 big clusters.
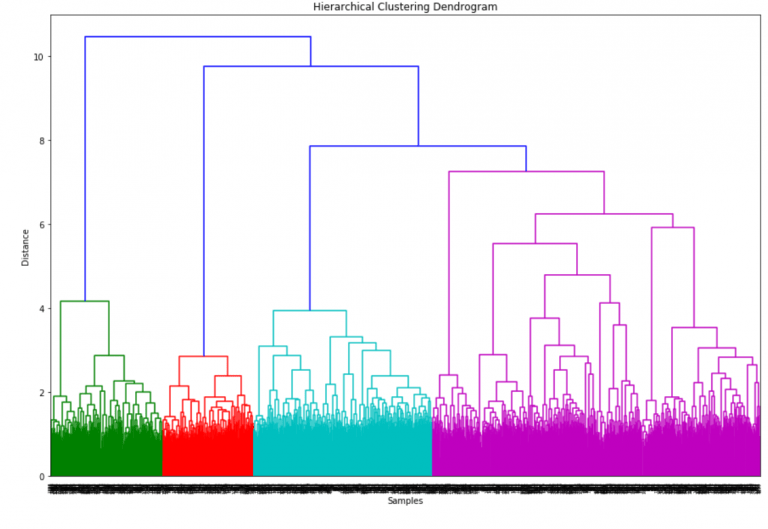
The tree shows that we can split our data into 4 big clusters. But we have more than 4 technologies, so we decided to tune the threshold which corresponds to the depth of the tree. When we reduce the threshold, the number of clusters increases. After several tries, we came up with 13 groups of resumes.
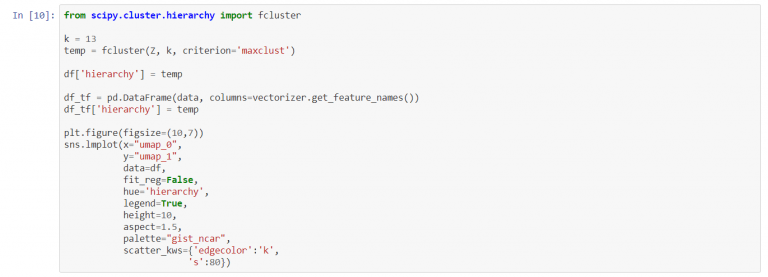
Have a look at the projection. There are colors added which correspond to new clusters.
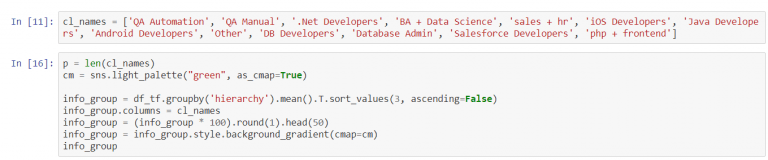
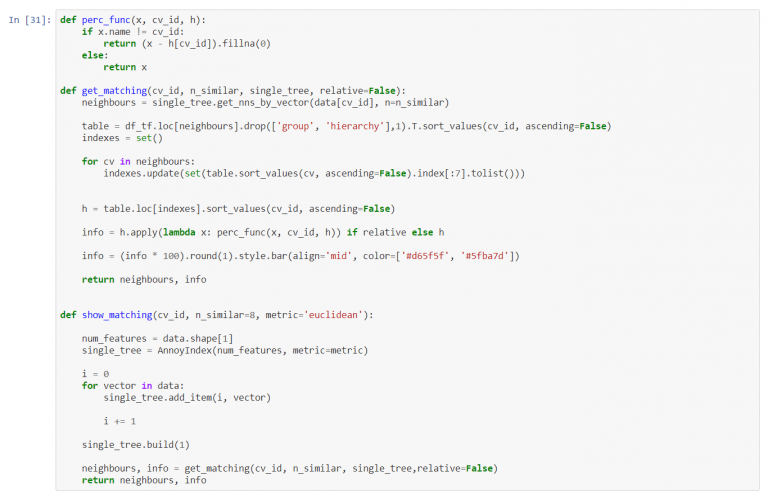
We used the following approach:
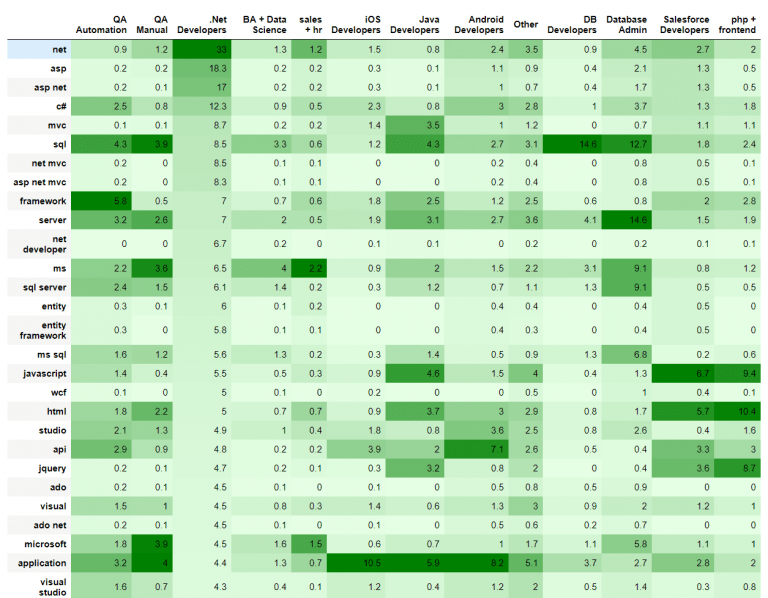
The last one gives us words or n-grams, which have the biggest “importance” values. Then we tried to describe and name the clusters based on words at the top of the table.
Finally, there are clusters’ names. We can add labels to the previous illustrations.

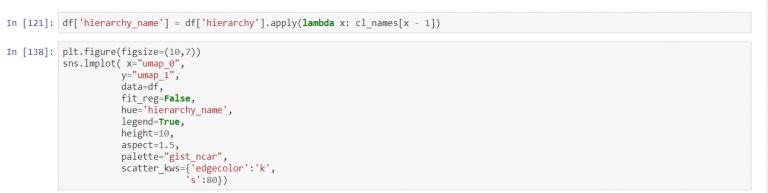
The analysis of this figure demonstrates the following:
As expected, there are points which are difficult to attribute to any particular cloud. This is one of the drawbacks of the hard clustering method. A suggested notion that an individual belongs to a single technology is not valid in every single case, so we had to identify another cluster as “Other”.
NB. The above described is just one of many possible clustering options. Depending on the purpose, we can modify the threshold and experiment with possible features extracted from the resumes
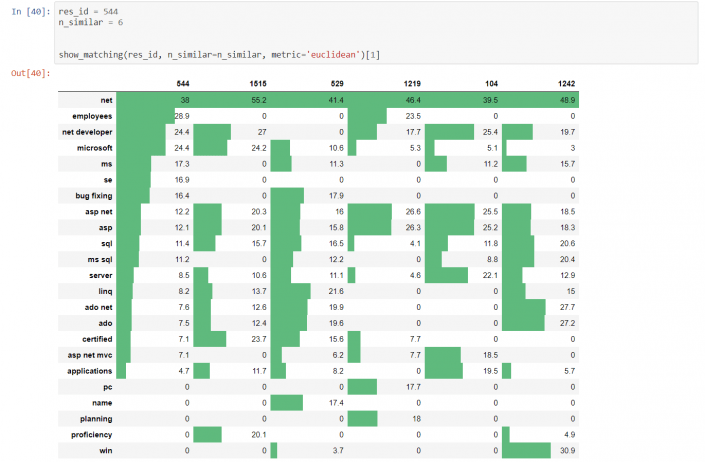
Now it’s time to identify similar candidates. It’s worth noting that we performed a search according to the way the resumes were written. It often happens that the technical skills of the specialists are very much alike but some include business aspects in it while others don’t. As a result, they will look different in our research.
But let’s assume that all the resumes showcase the candidates comprehensively. We will apply Annoy (Approximate Nearest Neighbors Oh Yeah), a C++ library with Python bindings, to search for the points in space that are close to a given query point. It allows us to get top ‘n’ resumes that are similar to a particular one. In order to compare the given resumes, it’s possible to visualize their features. Below is an example.
We have researched and applied a method of how unstructured text data for a specific field, namely, recruiting and resource management can be organized. With the right feature engineering it’s possible to split resumes into different groups without using complex algorithms.
Interestingly enough, TF-iDF transformation is a good way, not only for high model performance enhancement, but also for understanding the unlabeled data.
The main benefits of the applied method include:
Our data science team as a part of Avenga R&D unit builds innovative solutions utilizing cutting-edge technologies and improves internal processes as well as introduces new opportunities to our Clients.

Discover what is at the heart of a good software transition plan and what the transition journey consists of.

Create a curated workplace experience that simplifies a digital workplace. Viva Connections is a centralized solution within the Microsoft 365 ecosystem.

Explore the basics of document management in Microsoft 365. Examine the possibilities of integration OneDrive for Business, SharePoint, and Teams.

Empower your employees with modern intranet solutions. Discover essential criteria for maximizing employee engagement, productivity, and collaboration.

Explore the many high-impact applications of AI for greater efficiency in patient recruitment. This is an overview of recent developments in the field.

Explore essential applications of data and analytics in insurance. Learn how industry leaders use advanced analytics and generative AI for their competitiveness.

Discover how Artificial Intelligence (AI) and Machine Learning (ML) are changing the code of credit risk management in banking.

In our Avenga team, we have many dedicated volunteers, and today, we want to tell you the story of Nazar Bigun, a Senior NodeJS Engineer, who was chosen by his teammates at Avenga Ukraine as the Volunteer of the Year.
Ready to innovate your business?
We are! Let’s kick-off our journey to success!